Tracking serious traffic injuries in New York City
Last updated
Serious injury traffic crashes are often absent from the news and policymaking, despite life-altering consequences. Every year, these crashes leave thousands of New Yorkers with permanent disabilities, often requiring months of recovery.
Nearly one in three New Yorkers have been injured in traffic violence. For every person killed in a traffic crash in New York City, another 11 are severely injured.
Transportation Alternatives’ database tracks every traffic crash resulting in serious injury in New York City in an effort to broaden the conversation about Vision Zero and the preventable harm caused by giving so much space in our city to cars. This is the first time serious injury data has been analyzed for public consumption.
In this database, the definition of serious injuries follow New York State law, and includes any traffic crash-related injuries resulting in dismemberment, significant disfigurement, bone fracture, the loss of a fetus, as well as the permanent loss of use of a body part, organ,or function, the significant limitation of a body function, and any injury which prevents a person from performing most of their customary daily activities for 90 days or more.
New York City’s Vision Zero program is a mandate to eliminate all traffic fatalities and serious injuries, however the latter is often disregarded in policymaking and news reporting. Despite this disregard, these injuries are life-altering. Victims of serious injuries face significant hospital bills, unpredictable time off work, medical equipment costs, and the prospect of long term recovery care, therapy, and medical assistance. Traffic crashes are the leading cause of post-traumatic stress disorder. Ignorance to serious injuries is also detrimental to our ability to reach Vision Zero. Serious injuries occur at 11 times the rate of traffic fatalities, providing a more data-rich metric for identifying the most dangerous streets and intersections. In addition to the human cost, there is a significant financial burden to these dangerous streets: a 2010 estimate of the cost of traffic crashes in New York City totaled more than $4 billion annually.
The NYC Serious Injury Traffic Crash Database is based on crash investigations data published by the City of New York on its Open Data portal. The New York City Department of Transportation (DOT) and New York City Police Department investigate all crashes that involve severe injuries as well as fatalities, documenting the involved parties, their modes of transportation, and injuries recorded in hospital records. In 2011, Transportation Alternatives advocated for the creation of Local Law 49-2021, which requires DOT to release this data on a quarterly basis. Prior to this law’s passage this data was not publicly available.
No — Serious injury crashes are 21% higher in the 10 City Council districts with the greatest percentage of residents living below the poverty line and 15% higher in the 10 districts with the highest percentage of residents of color, compared to the citywide average.
- For bike riders, Manhattan had 77% more serious injuries per capita than the citywide average.
- For pedestrians, Manhattan had 25% more serious injuries per capita than the citywide average.
- For moped and e-bike riders, Brooklyn had 27% more serious injuries per capita than the citywide average.
- For motorists, Staten Island had 48% more serious injuries per capita than the citywide average.
people were seriously injured in crashes between January 2022 and June 2023.
pedestrians seriously injured
On average, pedestrians are seriously injured each week.
bike riders seriously injured
On average, people riding bikes are seriously injured each week.
motorists seriously injured
On average, motorists are seriously injured each week.
other motorists seriously injured
On average, other motorists are seriously injured each week.
Serious Injuries by Borough
More than 4,200 people were seriously injured by crashes since January 2022. Below is a breakdown by borough and mode:
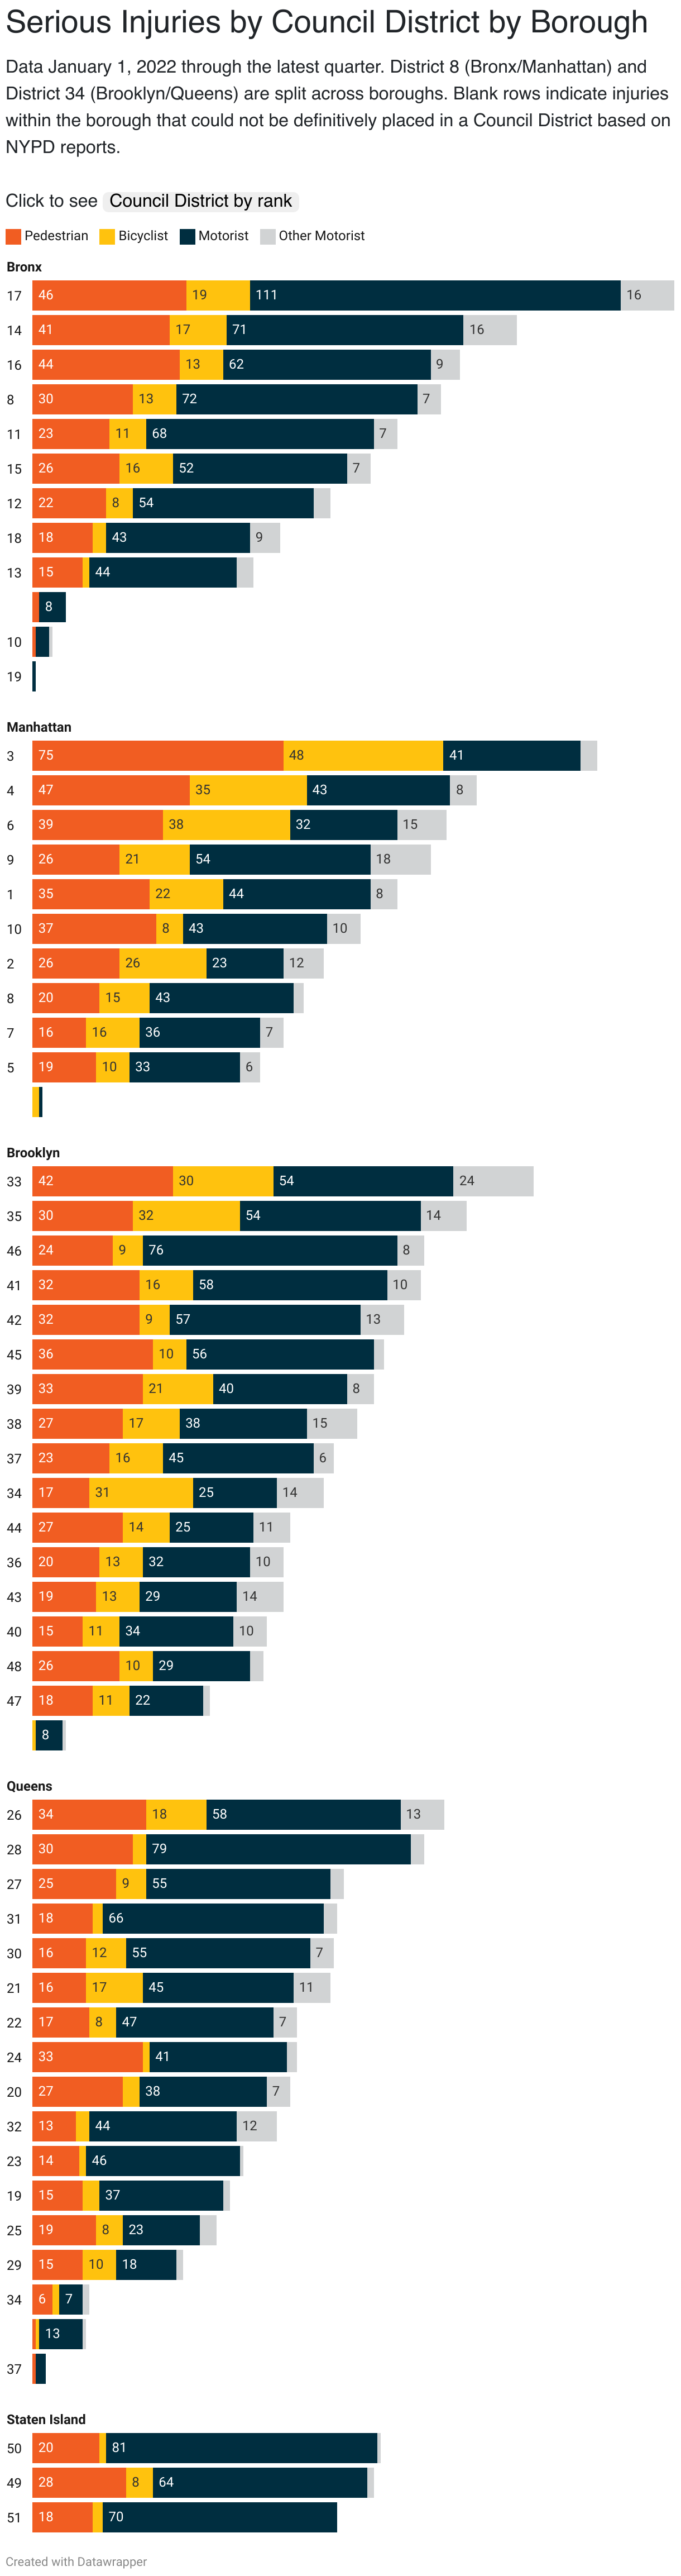
Serious Injuries by Council District
View a breakdown of serious injuries by mode and by council district:
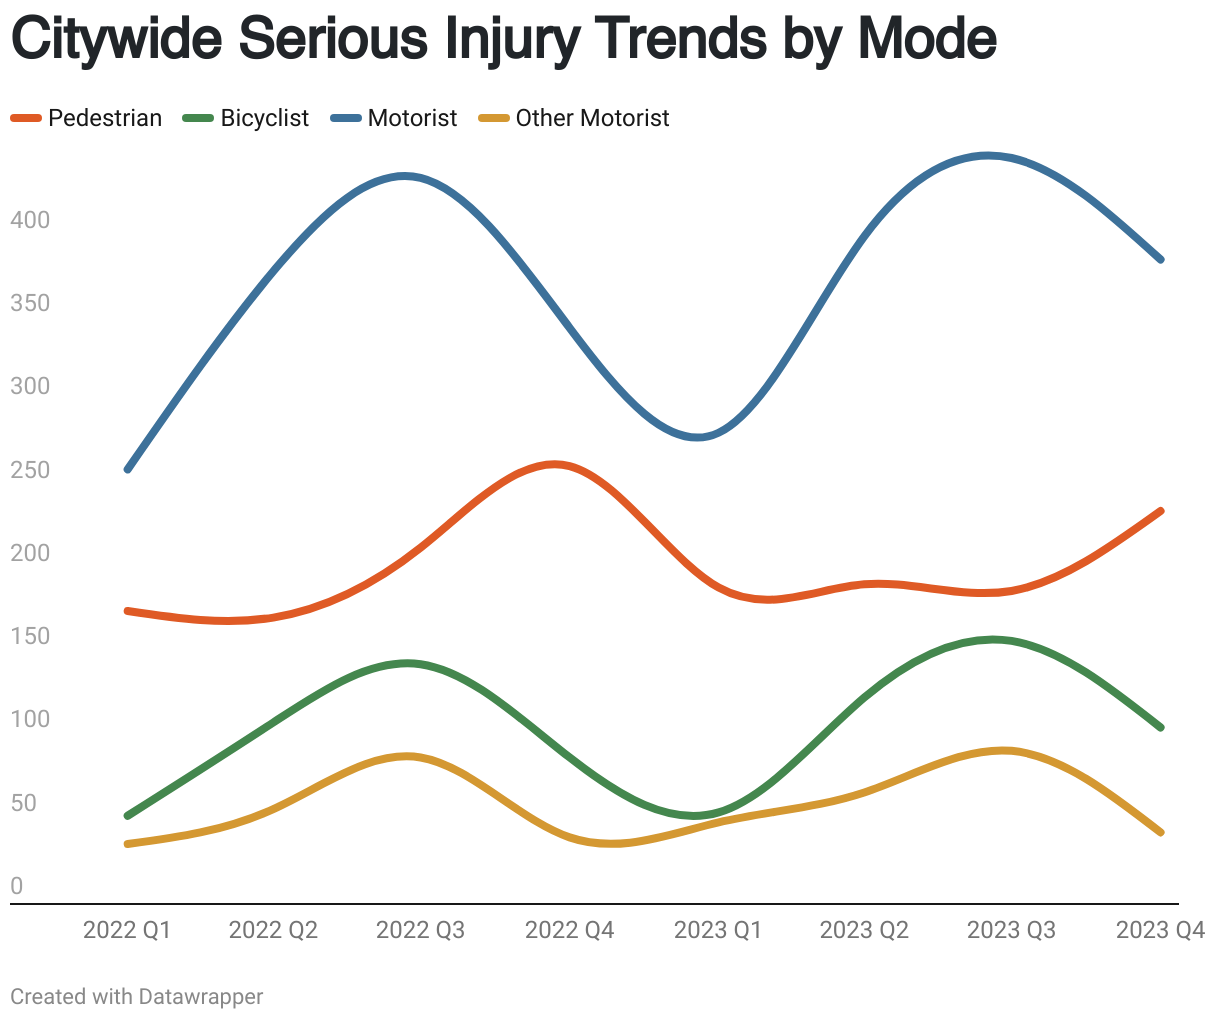
Serious Injury Trends
How can we prevent serious injuries?
To reduce traffic injuries in your neighborhood, pay attention to the design and use of public spaces. Here are a few ways to improve spatial equity:
- Install traffic-calming infrastructure to reduce traffic crashes in districts with a high rate of traffic fatalities. In New York City, the number of people killed or severely injured in crashes declined with the installation of traffic calming devices, including reductions of 36% with pedestrian islands, 34% with curb and sidewalks extensions, and 18% reduction with protected bike lanes. These reductions would multiply when traffic calming devices are layered across a high-risk community.
- Create a “low traffic neighborhood” in residential areas adjacent to arterial roads by discouraging through traffic with automated enforcement and infrastructure to control and filter different traffic modes. After low-traffic neighborhoods were created in London, injurious crashes fell by 75%, and fatal and serious injury crashes fell by 53%.
- Convert car lanes to bus and bike lanes in districts with high rates of traffic injuries. Converting a car driving lane into pedestrian and bus infrastructure on Manhattan’s First and Second avenues led to a 21% decrease in traffic injuries without lowering traffic volume. The City of New York has found that the removal of car travel lanes leads to an average 30% reduction in people killed or seriously injured.
Take action!
Tell Mayor Adams to implement the legally-required NYC Streets Plan and build streets that protect New Yorkers from crashes.
Send a messageMethodology
Transportation Alternatives’ database is based on the legally-required serious injury data published by DOT. To identify missing locations and mode of serious injury, TA cross-referenced NYPD Open Data sets with DOT's reporting.